


Bafilomycin A1
Bafilomycin A1 (Baf A1) is a macrolide with the antibiotic properties. It specifically and effectively inhibits the V-type ATPase. The absolute stereochemistry is also determined via a x-rays crystallographic study and its molecular structure is diagrammatically depicted in Figure 1. The complete process for its synthesis is well documented in detail in scientific literature.
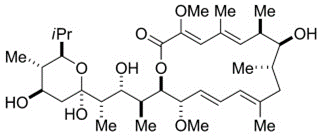
Figure 1 The Molecular Structure of Bafilomycin A1 as determined via a x-rays crystallographic study (Baf A1)
It has been shown in a murine-based scientific research that Bafilomycin A1 (Baf A1) increases the rate of wound healing in the skin which is statistically as well as clinically significant. The animal model used in that scientific research was mice with a full thickness skin wound on their dorsal (back) sides. The murine model used in that scientific research is shown in Figure 2.
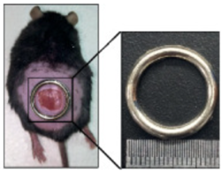
Figure 2 The animal model, i.e., murine model, with a full thickness skin wound on its dorsal side (back side)
These mice were labelled as normal mice are db/m, diabetic mice without Baf A1 treatment are db/db and diabetic mice with Baf A1 treatment are Baf A1. It can be seen that wound healing is observed in all of these cases, with the primary difference in the rate of the wound healing process when the wound healing is macroscopically observed. In normal mice, the rate of wound healing was the maximum/ highest. For diabetic mice, the rate of wound healing in the Baf A1 treated mice was greater than the rate of wound healing in the Baf A1 untreated mice; this clearly shows that Baf A1 increases the rate of wound healing in the diabetic mice model. This is scientifically evident from Figure 3.
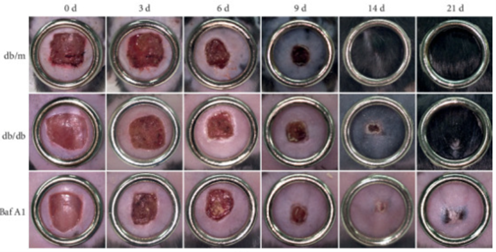
Figure 3 Bafilomycin A1 (Baf A1) increases the rate of wound healing process in the murine model having diabetes. Legends: db/m are the normal mice that acts as a control in that experiment for both db/db and Baf A1, db/db are the diabetic mice without Baf A1 treatment and Baf A1 are the diabetic mice with Baf A1 treatment.
Wound closure is the end point of the wound healing process, which is graphically compared for these three labelled mice groups in Figure 4. After 9 days, the wound closure rate in the Bafilomycin A1 treated mice had become very close to that of the normal mice group db/m.
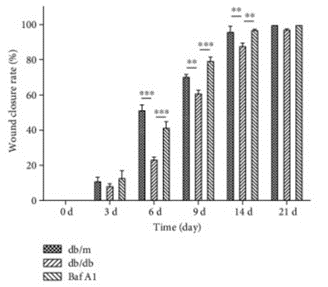
Figure 4 Bafilomycin A1 (Baf A1) treatment increases the pace of the wound healing process, which is significantly close to the wound healing process in the normal mice/ non diabetic ones after 9 days onwards. It took a visible increase after 6 days
After the macroscopic studies, the healed skin wounds were subjected to microscopic studies, i.e., histological studies via Hematoxylin and Eosin (H&E) staining. The histological micrographs of these healed skin wounds are demonstrated in Figure 5. As shown in Figure 5, in db/m normal mice, maximum/ highest degree of wound healing is present. Moreover, all the structures like basal layer and strata, i.e., spinosum, granulosum, lucidum, and corneum, etc. could be clearly observed both in the zoomed in image sections of db/m normal mice and Baf A1 treated diabetic mice (in the left). Furthermore, the thickness of the epidermis as well as the length of the wound area greater in these two groups when compare with the db/db diabetic mice. These two findings are graphically illustrated in Figure 6 and Figure 7 .Finally, the overall microscopic structure of the skin tissue after healing is convincing that Bafilomycin A1 (Baf A1) has an excellent healing effect.
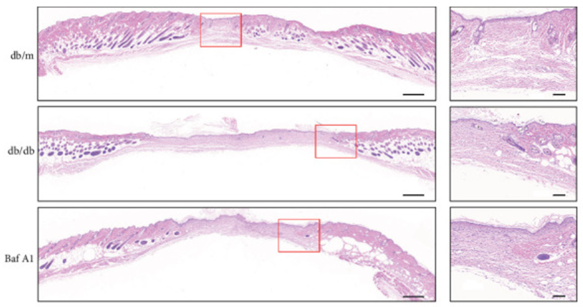
Figure 5 The Histological Analysis of the closed skin wound on the dorsal side of the murine model. In left images, the skin tissue in the periphery is all normal/ healed, on the other hand the middle region is unhealed yet. Keep in mind that these are the histologic images and these wound lengths are much shorter macroscopically. The areas within the red squares are zoomed in and shown in the right-side panel.
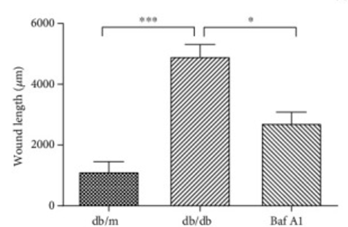
Figure 6 The Wound length in db/m normal mice, db/db diabetic mice without Baf A1 and Baf A1 diabetic mice with Baf A1. The wound length in db/m and Baf A1 is less than the db/db
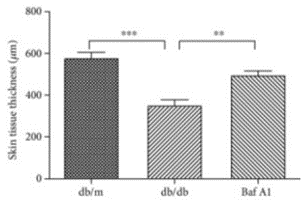
Figure 7 The Thickness of epidermis in db/m normal mice, db/db diabetic mice without Baf A1 and Baf A1 diabetic mice with Baf A1. The thickness of the epidermis in db/m and Baf A1 is greater than db/db
Light chain 3 (LC3) is a Microtubule-associated protein that is a molecular marker of autophagy phenomenon, thus would be present inside the cytoplasm of the cells. The amount of LC3-2, i.e., a specific LC3, is associated with the number of autophagosomes. An adaptor protein P62 modifies LC3-2 into a potential substrate for ubiquitination, which is later integrated into phagosome. This is the called the autophagic flux. The amounts of these two proteins, i.e., is assessed via immunofluorescence. The results are microscopically demonstrated in Figure 8. It is quite obvious that the autophagic flux is activated in db/db diabetic mice without Baf A1 treatment as indicated by the upregulation of LC3-2 and downregulation of P62. Similarly, the autophagic flux is deactivated in Baf A1 diabetic mice with Baf A1 treatment as indicated by the upregulation of LC3-2 and P62. Interestingly, along with that Baf A1 treatment has a minor effect on the metabolism in the mice in terms of body weight, glucose, cholesterol, triglycerides and β-hydroxybutyrate levels in the serum.
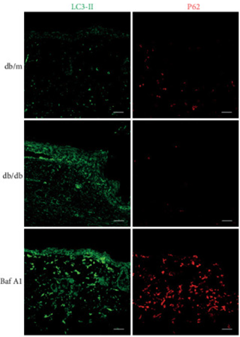
Figure 8 The expression of two proteins, i.e., LC3-2 and P62, out of which the former is the marker of autophagy; their expression is highlighted via immunofluorescence technique, i.e., in green and in red respectively
PNCA protein is a molecular marker of the cell proliferation, its upregulated expression is observed in the keratocytes of Baf A1 treated diabetic mice. This is diagrammatically illustrated in Figure 9, while the density of these cells as the number of these cells per unit volume, is graphically illustrated in Figure 10.
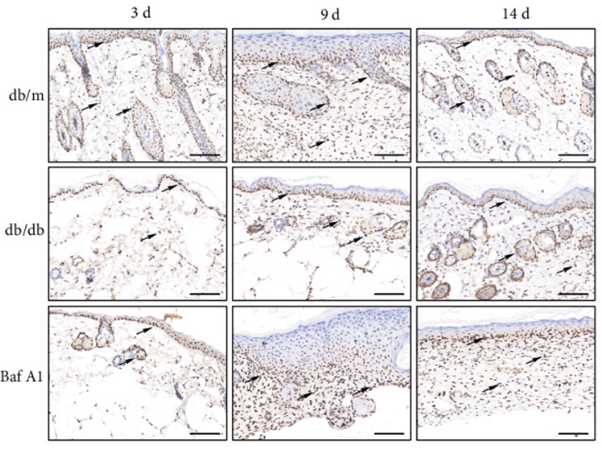
Figure 9 Cells expressing PNCA protein are indicated by the black arrows in the db/m normal mice, db/db diabetic mice without Baf A1 and Baf A1 diabetic mice with Baf A1 treatment
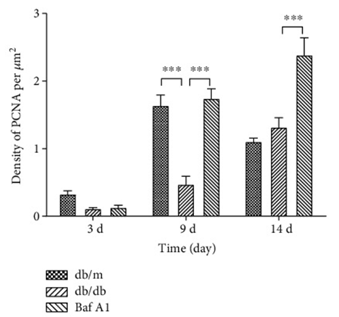
Figure 10 Density of PCNA expressing cells in the db/m normal mice, db/db diabetic mice without Baf A1 and Baf A1 diabetic mice with Baf A1 treatment
The wound healing in the Baf A1 is marked by the presence of thick collagen layer. The proliferation of the fibroblasts and subsequent collagen formation leads to the contraction of the wound and ultimately its closure. The increased thickness of collagen in the Baf A1 group is diagrammatically illustrated in Figure 11
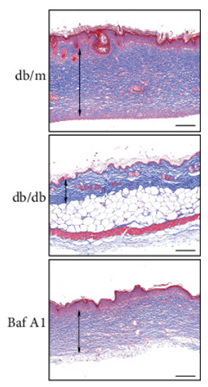
Figure 11 The thickness of collagen layer in the db/m normal mice, db/db diabetic mice without Baf A1 and Baf A1 diabetic mice with Baf A1 treatment
Inflammation is the first and foremost step of the overall wound healing process. The success of the wound healing is dependent on the regulated inflammatory response; and Baf A1 regulates it.


Commentaires