

QL9 |
カタログ番号GC30580
 One-Click Copy Product Info
|

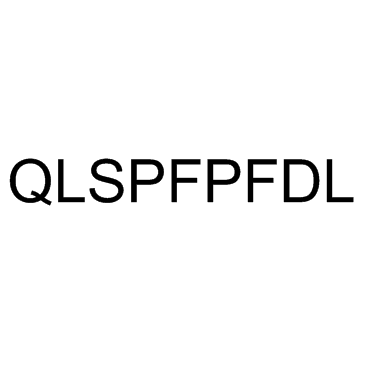
QL9 (QLSPFPFDL) は、2C T 細胞受容体 (TCR) に対する高親和性同種抗原です。
Products are for research use only. Not for human use. We do not sell to patients.
Cas No.: 159646-83-0
Sample solution is provided at 25 µL, 10mM.
_1-3.$$$39978408@51.jpg');)
_1-9.$$$38538795@65.jpg');)
_1-9.$$$39112701@51.jpg');)
_1-7.$$$37316672@70.jpg');)
_366-372.$$$36198801@70.jpg');)
.$$$38565142@65.jpg');)
_1867-1883.$$$33248023@67.jpg');)
_eads6055.$$$39977546@45.jpg');)
_eadm9805.$$$40080571@45.jpg');)
_eadj3020.$$$39666821@45.jpg');)
_1-20.$$$39757301@28.jpg');)
_1-24.$$$38898113@28.jpg');)
_273-287.$$$36806353@46.jpg');)
_1-16.$$$37156877@44.jpg');)
_1-19.$$$37460805@44.jpg');)
_1291-1307.$$$34518654@46.jpg');)
QL9 (QLSPFPFDL) is a high-affinity alloantigen for the 2C T cell receptor (TCR).
Mouse T cell clone 2C recognizes two different major histocompatibility (MHC) ligands, the self MHC Kb and the allogeneic MHC Ld. Two distinct peptides, SIY (SIYRYYGL) and QL9 (QLSPFPFDL), act as strong and specific agonists when bind to Kb and Ld, respectively. QL9 binding to MHC Ld is influenced by the majority of peptide side chains, distributed across the entire length of the peptide. Findings with both systems, but QL9-Ld in particular, suggest that many single-residue substitutions, introduced into peptides to improve their binding to MHC and thus their vaccine potential, could impair T cell reactivity due to their dual impact on TCR binding. T cell activation assays are performed to measure effects of peptide SIY and QL9 residues on T cell function[2].
[1]. Speir JA, et al. Structural basis of 2C TCR allorecognition of H-2Ld peptide complexes. Immunity. 1998 May;8(5):553-62. [2]. Bowerman NA, et al. Different strategies adopted by K(b) and L(d) to generate T cell specificity directed against their respective bound peptides. J Biol Chem. 2009 Nov 20;284(47):32551-61.
Cell experiment: | Wild type 2C and high affinity 2C T cell transfectants m67 and m6 are incubated with Kb- or Ld-positive cells and various concentrations of peptide SIY and QL9 alanine variants. T cell activation is measured by assaying for levels of IL-2 release. Briefly, T cell transfectants (7.5×10⁴) are incubated with T2-Kb (7.5×10⁴) or T2-Ld (7.5×10⁴) along with various concentrations of peptide for 20-24 h at 37 °C and 5% CO2. Supernatant is harvested, and levels of IL-2 are measured in an enzyme-linked immunosorbent assay type format. Results are plotted as percentage of maximal IL-2 release=((A450 (sample)-A450(no peptide))/(Max A450(sample)-A450(no peptide)))×100; signal obtained from no peptide is similar to that obtained for the null peptides MCMV or OVA. Binding curves are generated in GraphPad Prism by plotting the percentage of maximal IL-2 release against peptide concentration. The concentrations of peptide yielding 50% maximal IL-2 release (SD50) are calculated using non-linear regression (sigmoidal fitting; GraphPad Prism) of the activation curves[2]. |
References: [1]. Speir JA, et al. Structural basis of 2C TCR allorecognition of H-2Ld peptide complexes. Immunity. 1998 May;8(5):553-62. | |
| Cas No. | 159646-83-0 | SDF | |
| Canonical SMILES | Gln-Leu-Ser-Pro-Phe-Pro-Phe-Asp-Leu | ||
| Formula | C52H74N10O14 | M.Wt | 1063.21 |
| 溶解度 | Water : 33.33 mg/mL (31.35 mM) | Storage | Store at -20°C |
| General tips | Please select the appropriate solvent to prepare the stock solution according to the
solubility of the product in different solvents; once the solution is prepared, please store it in
separate packages to avoid product failure caused by repeated freezing and thawing.Storage method
and period of the stock solution: When stored at -80°C, please use it within 6 months; when stored
at -20°C, please use it within 1 month. To increase solubility, heat the tube to 37°C and then oscillate in an ultrasonic bath for some time. |
||
| Shipping Condition | Evaluation sample solution: shipped with blue ice. All other sizes available: with RT, or with Blue Ice upon request. | ||
| Prepare stock solution | |||
|
1 mg | 5 mg | 10 mg |
| 1 mM | 940.5 μL | 4.7027 mL | 9.4055 mL |
| 5 mM | 188.1 μL | 940.5 μL | 1.8811 mL |
| 10 mM | 94.1 μL | 470.3 μL | 940.5 μL |
Step 1: Enter information below (Recommended: An additional animal making an allowance for loss during the experiment)
 g
μL
g
μL
Step 2: Enter the in vivo formulation (This is only the calculator, not formulation. Please contact us first if there is no in vivo formulation at the solubility Section.)
Calculation results:
Working concentration: mg/ml;
Method for preparing DMSO master liquid: mg drug pre-dissolved in μL DMSO ( Master liquid concentration mg/mL, Please contact us first if the concentration exceeds the DMSO solubility of the batch of drug. )
Method for preparing in vivo formulation: Take μL DMSO master liquid, next addμL PEG300, mix and clarify, next addμL Tween 80, mix and clarify, next add μL saline, mix and clarify.
Method for preparing in vivo formulation: Take μL DMSO master liquid, next add μL Corn oil, mix and clarify.
Note: 1. Please make sure the liquid is clear before adding the next solvent.
2. Be sure to add the solvent(s) in order. You must ensure that the solution obtained, in the previous addition, is a clear solution before proceeding to add the next solvent. Physical methods such as vortex, ultrasound or hot water bath can be used to aid dissolving.
3. All of the above co-solvents are available for purchase on the GlpBio website.
Quality Control & SDS
- View current batch:
- Purity: >98.00% Appearance: A solid
- COA (Certificate of Analysis)
- SDS (Safety Data Sheet)
- Datasheet
Average Rating: 5 (Based on Reviews and 10 reference(s) in Google Scholar.)