

CTPI-2 |
Katalog-Nr.GC19138
 One-Click Copy Product Info
|

CTPI-2 ist ein mitochondrialer CitrattrÄger-SLC25A1-Inhibitor der dritten Generation mit einer KD von 3,5 μM.
Products are for research use only. Not for human use. We do not sell to patients.
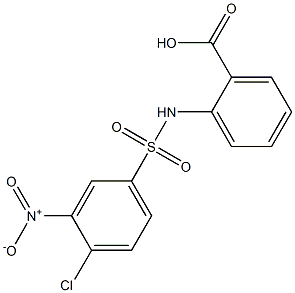
Cas No.: 68003-38-3
Sample solution is provided at 25 µL, 10mM.
_1-3.$$$39978408@51.jpg');)
_1-9.$$$38538795@65.jpg');)
_1-9.$$$39112701@51.jpg');)
_1-7.$$$37316672@70.jpg');)
_366-372.$$$36198801@70.jpg');)
.$$$38565142@65.jpg');)
_1867-1883.$$$33248023@67.jpg');)
_eads6055.$$$39977546@45.jpg');)
_eadm9805.$$$40080571@45.jpg');)
_eadj3020.$$$39666821@45.jpg');)
_1-20.$$$39757301@28.jpg');)
_1-24.$$$38898113@28.jpg');)
_273-287.$$$36806353@46.jpg');)
_1-16.$$$37156877@44.jpg');)
_1-19.$$$37460805@44.jpg');)
_1291-1307.$$$34518654@46.jpg');)
CTPI-2 is a mitochondrial citrate carrier SLC25A1 inhibitor (KD=3.5μM). CTPI-2 blocks mitochondrial citrate export, thereby inhibiting glycolysis, PPARγ and its downstream target glucose transporter GLUT4. CTPI-2 regulates lipid synthesis, redox balance and metabolic signaling. CTPI-2 can be used in studies of non-small cell lung cancer, non-alcoholic steatohepatitis (NASH) and obesity-related metabolic diseases[1-4].
In vitro, treatment of H1299 cells and non-small cell lung cancer T1/T2/T3 spheroid CSC cultures with 3μM CTPI-2 for 3 hours inhibited mitochondrial respiratory rate, sphere-forming ability, self-renewal capacity and matrix invasion ability[5]. Pretreatment of A549, NCI-H460, U87-MG and T98G cells with 200μM CTPI-2 for 2 hours prior to ionizing radiation increased radiation-induced DNA damage, delayed the clearance of γH2AX and Rad51, and reduced clonogenic survival fraction. Treatment of NCI-H460 cells with 200μM CTPI-2 for 24 hours reduced viable cell number, increased cytoplasmic and mitochondrial ROS, apoptosis and cell death levels, and decreased KDM4 enzyme activity[6].
In vivo, intraperitoneal injection of 50mg/kg CTPI-2 every other day for 12 weeks in high-fat diet-fed C57BL/6J mice prevented body weight gain or induced weight loss, reduced white visceral adipose tissue and liver mass, reversed hepatic micro- and macrovesicular steatosis and hepatocyte ballooning, decreased serum cholesterol, alanine aminotransferase and triglyceride levels, and restored normal fasting glucose and insulin tolerance/glucose tolerance test curves[7]. Intraperitoneal injection of 50mg/kg CTPI-2 every other day (twice per week) for 6 weeks in fElasCreERT/LSL-KrasG12D/+ double transgenic mice (KrasG12D/4) expressing KRASG12D in pancreatic acinar cells and previously fed a high-fat diet for 6 weeks reduced abdominal fat accumulation, decreased pancreatic tissue lipid droplet content, alleviated pancreatic PanIN lesions and collagen deposition, preserved acinar cell amylase and CK19 expression, and reduced liver fat accumulation[8].
References:
[1] Wenta T, Wang G, Van Buren T, et al. Mitochondrial CLPB is a pro-survival factor at the onset of granulocytic differentiation of mouse myeloblastic cells. Apoptosis. 2025 Feb;30(1-2):334-348.
[2] Martini H, Birch J, Marques FDM, et al. Mitochondrial metabolism and epigenetic crosstalk drive SASP. Nature. 2026 Aug;656(8129):980-992. doi: 10.1038/s41586-026-10791-2. Epub 2026 Jul 29.
[3] Zhang Z, Qiao Y, Sun Q, et al. A novel SLC25A1 inhibitor, parthenolide, suppresses the growth and stemness of liver cancer stem cells with metabolic vulnerability. Cell Death Discov. 2023 Sep 23;9:350.
[4] Li J, Yang T, Li Y, et al. SLC25A1 upregulation promotes HNSCC cisplatin resistance via H3K27ac-mediated cellular senescence. npj Precis Oncol. 2026;10:226.
[5] Fernandez HR, Gadre SM, Tan M, et al. The mitochondrial citrate carrier, SLC25A1, drives stemness and therapy resistance in non-small cell lung cancer. Cell Death Differ. 2018 Jul;25(7):1239-1258.
[6] Xiang K, Kalthoff C, Münch C, et al. Accumulation of oncometabolite D-2-Hydroxyglutarate by SLC25A1 inhibition: A metabolic strategy for induction of HR-ness and radiosensitivity. Cell Death Dis. 2022 Jul 22;13(7):641.
[7] Tan M, Mosaoa R, Graham GT, et al. Inhibition of the mitochondrial citrate carrier, Slc25a1, reverts steatosis, glucose intolerance, and inflammation in preclinical models of NAFLD/NASH. Cell Death Differ. 2020 Jul;27(7):2143-2157.
[8] Zhang R, Peng X, Du JX, et al. Oncogenic KRASG12D reprograms lipid metabolism by upregulating SLC25A1 to drive pancreatic tumorigenesis. Cancer Res. 2023 Nov 15;83(22):3739-3752.
| Cell experiment [1]: | |
|
Cell lines |
A549 cells, NCI-H460 cells (human non-small cell lung cancer cell line), U87-MG cells, T98G cells (human glioblastoma cell line) |
|
Preparation Method |
A549, NCI-H460, U87-MG and T98G cells were treated with CTPI-2 at 200μM for 2h before irradiation (5Gy or 30Gy), followed by assays for D-2-HG level (6h after CTPI-2), γH2AX/Rad51 foci (6h and 24h after IR), alkaline comet assay (6h after IR), KDM4 activity (24h CTPI-2), Seahorse OCR/ECAR (24h CTPI-2), NAD+/NADH and NADP+/NADPH ratios (24h CTPI-2), crystal violet viability (24h CTPI-2), flow cytometry for ROS/apoptosis/cell death (24h CTPI-2), and colony formation (2h CTPI-2 + IR 2/5/8Gy). NCI-H460 cells were also treated with CTPI-2 200μM plus PJ34 4μM or NU7447 4μM for 2h before IR. |
|
Reaction Conditions |
200μM; 2h pre-IR (or 24h for metabolic/viability assays) |
|
Applications |
CTPI-2 increased intracellular D-2-HG levels, enhanced radiation-induced γH2AX and Rad51 foci formation and delayed their resolution, augmented alkaline comet tail DNA damage, reduced KDM4 activity, inhibited basal and maximal mitochondrial respiration and mitochondrial ATP production, raised NAD+/NADH and NADP+/NADPH ratios, reduced living cell numbers, elevated cytoplasmic and mitochondrial ROS, apoptosis and cell death, and decreased clonogenic survival of irradiated cells; combining CTPI-2 with PJ34 or NU7447 further increased γH2AX foci and reduced survival. |
| Animal experiment [2]: | |
|
Animal models |
C57BL/6J mice (diet-induced obesity model) |
|
Preparation Method |
C57BL/6J mice were fed a high-fat diet (60% calories from fat, 20% from sucrose) starting at 4-6 weeks of age. In the prevention study, CTPI-2 was administered at 50mg/kg via intraperitoneal injection on alternate days starting at the same time as high-fat diet initiation for up to 15 weeks. In the reversion study, mice were first fed the high-fat diet for 3 months, then received CTPI-2 at 50mg/kg via intraperitoneal injection on alternate days for 12 weeks. At sacrifice, liver, white adipose tissue, serum and other organs were collected for histopathology, immunohistochemistry (F4/80, Slc25a1), biochemical assays (ALT, cholesterol, triglycerides, glucose), GTT/ITT, MRI, and RNA-seq/qPCR analyses. |
|
Dosage form |
50mg/kg; i.p.; alternate-day injection for 12 weeks |
|
Applications |
CTPI-2 averted body weight gain in the prevention setting and induced weight loss in the reversion setting, reduced white adipose tissue and liver mass, reversed micro- and macrovesicular steatosis and hepatocyte ballooning, normalized serum cholesterol, alanine aminotransferase and triglyceride levels, restored fasting glucose and insulin/glucose tolerance test curves, downregulated Slc25a1 protein in liver and adipose tissue, reduced circulating IL-6/MCP-1/MIG and increased IL-4/IL-10, decreased F4/80-positive Kupffer cells and adipose crown-like structures, suppressed liver TNFα/iNOS/M1 markers and Collagen-1/4/Keratin-19/PDGFR while increasing Catherin-1, lowered hepatic citrate/Ac-CoA/malate/lactate and long-chain TAG/free fatty acids, and repressed SREBP1/FASN/ACACA/PPARγ/CEBPA1/2/GLUT4 and Fbp1/PC/PCK1/2/G6PC/G6PC3/AldoA/B expression. |
References: [1] Xiang K, Kalthoff C, Münch C, et al. Accumulation of oncometabolite D-2-Hydroxyglutarate by SLC25A1 inhibition: A metabolic strategy for induction of HR-ness and radiosensitivity. Cell Death Dis. 2022 Jul 22;13(7):641. [2] Tan M, Mosaoa R, Graham GT, et al. Inhibition of the mitochondrial citrate carrier, Slc25a1, reverts steatosis, glucose intolerance, and inflammation in preclinical models of NAFLD/NASH. Cell Death Differ. 2020 Jul;27(7):2143-2157. | |
| Cas No. | 68003-38-3 | SDF | |
| Chemical Name | 2-((4-chloro-3-nitrophenyl)sulfonamido)benzoic acid | ||
| Formula | C13H9CIN2O6S | M.Wt | 356.74 |
| Löslichkeit | DMSO:125 mg/mL(350.40 mM) | Storage | Store at -20°C |
| Shipping Condition | Evaluation sample solution: shipped with blue ice. All other sizes available: with RT, or with Blue Ice upon request. | ||
| Prepare stock solution | |||
|
1 mg | 5 mg | 10 mg |
| 1 mM | 2.8032 mL | 14.0158 mL | 28.0316 mL |
| 5 mM | 560.6 μL | 2.8032 mL | 5.6063 mL |
| 10 mM | 280.3 μL | 1.4016 mL | 2.8032 mL |
Step 1: Enter information below (Recommended: An additional animal making an allowance for loss during the experiment)
 g
μL
g
μL
Step 2: Enter the in vivo formulation (This is only the calculator, not formulation. Please contact us first if there is no in vivo formulation at the solubility Section.)
Calculation results:
Working concentration: mg/ml;
Method for preparing DMSO master liquid: mg drug pre-dissolved in μL DMSO ( Master liquid concentration mg/mL, Please contact us first if the concentration exceeds the DMSO solubility of the batch of drug. )
Method for preparing in vivo formulation: Take μL DMSO master liquid, next addμL PEG300, mix and clarify, next addμL Tween 80, mix and clarify, next add μL saline, mix and clarify.
Method for preparing in vivo formulation: Take μL DMSO master liquid, next add μL Corn oil, mix and clarify.
Note: 1. Please make sure the liquid is clear before adding the next solvent.
2. Be sure to add the solvent(s) in order. You must ensure that the solution obtained, in the previous addition, is a clear solution before proceeding to add the next solvent. Physical methods such as vortex, ultrasound or hot water bath can be used to aid dissolving.
3. All of the above co-solvents are available for purchase on the GlpBio website.
Quality Control & SDS
- View current batch:
- Purity: >98.50% Appearance: A solid
- COA (Certificate of Analysis)
- SDS (Safety Data Sheet)
- Datasheet
Average Rating: 5 (Based on Reviews and 34 reference(s) in Google Scholar.)